Sessions: Every experience that is run within the Altoura Client is recorded as a Session within the Altoura system. If a user runs an experience 5 times they are recorded as 5 different sessions and data is available for all the 5 sessions. Users can access detailed information about these sessions and the trainees by utilizing the filters located in the left pane. A Sample Report is as shown below: The Report is divided into a Filter (left) pane and Data (right) pane.

Filter Pane

The Filter Pane has four controls that lets the user filter the records that will be displayed on the right pane.
  • the first filter [Training Dates] helps to filter data using a date range.
  • the second filter [Username] lets the user select one or more trainees.
  • the third filter [Session Completed] helps to filter and view the trainings that were completed.
  • the fourth filter [Session Mode] helps to filter trainings based on how they were run, if it was run in Practice mode or an Assessment mode.
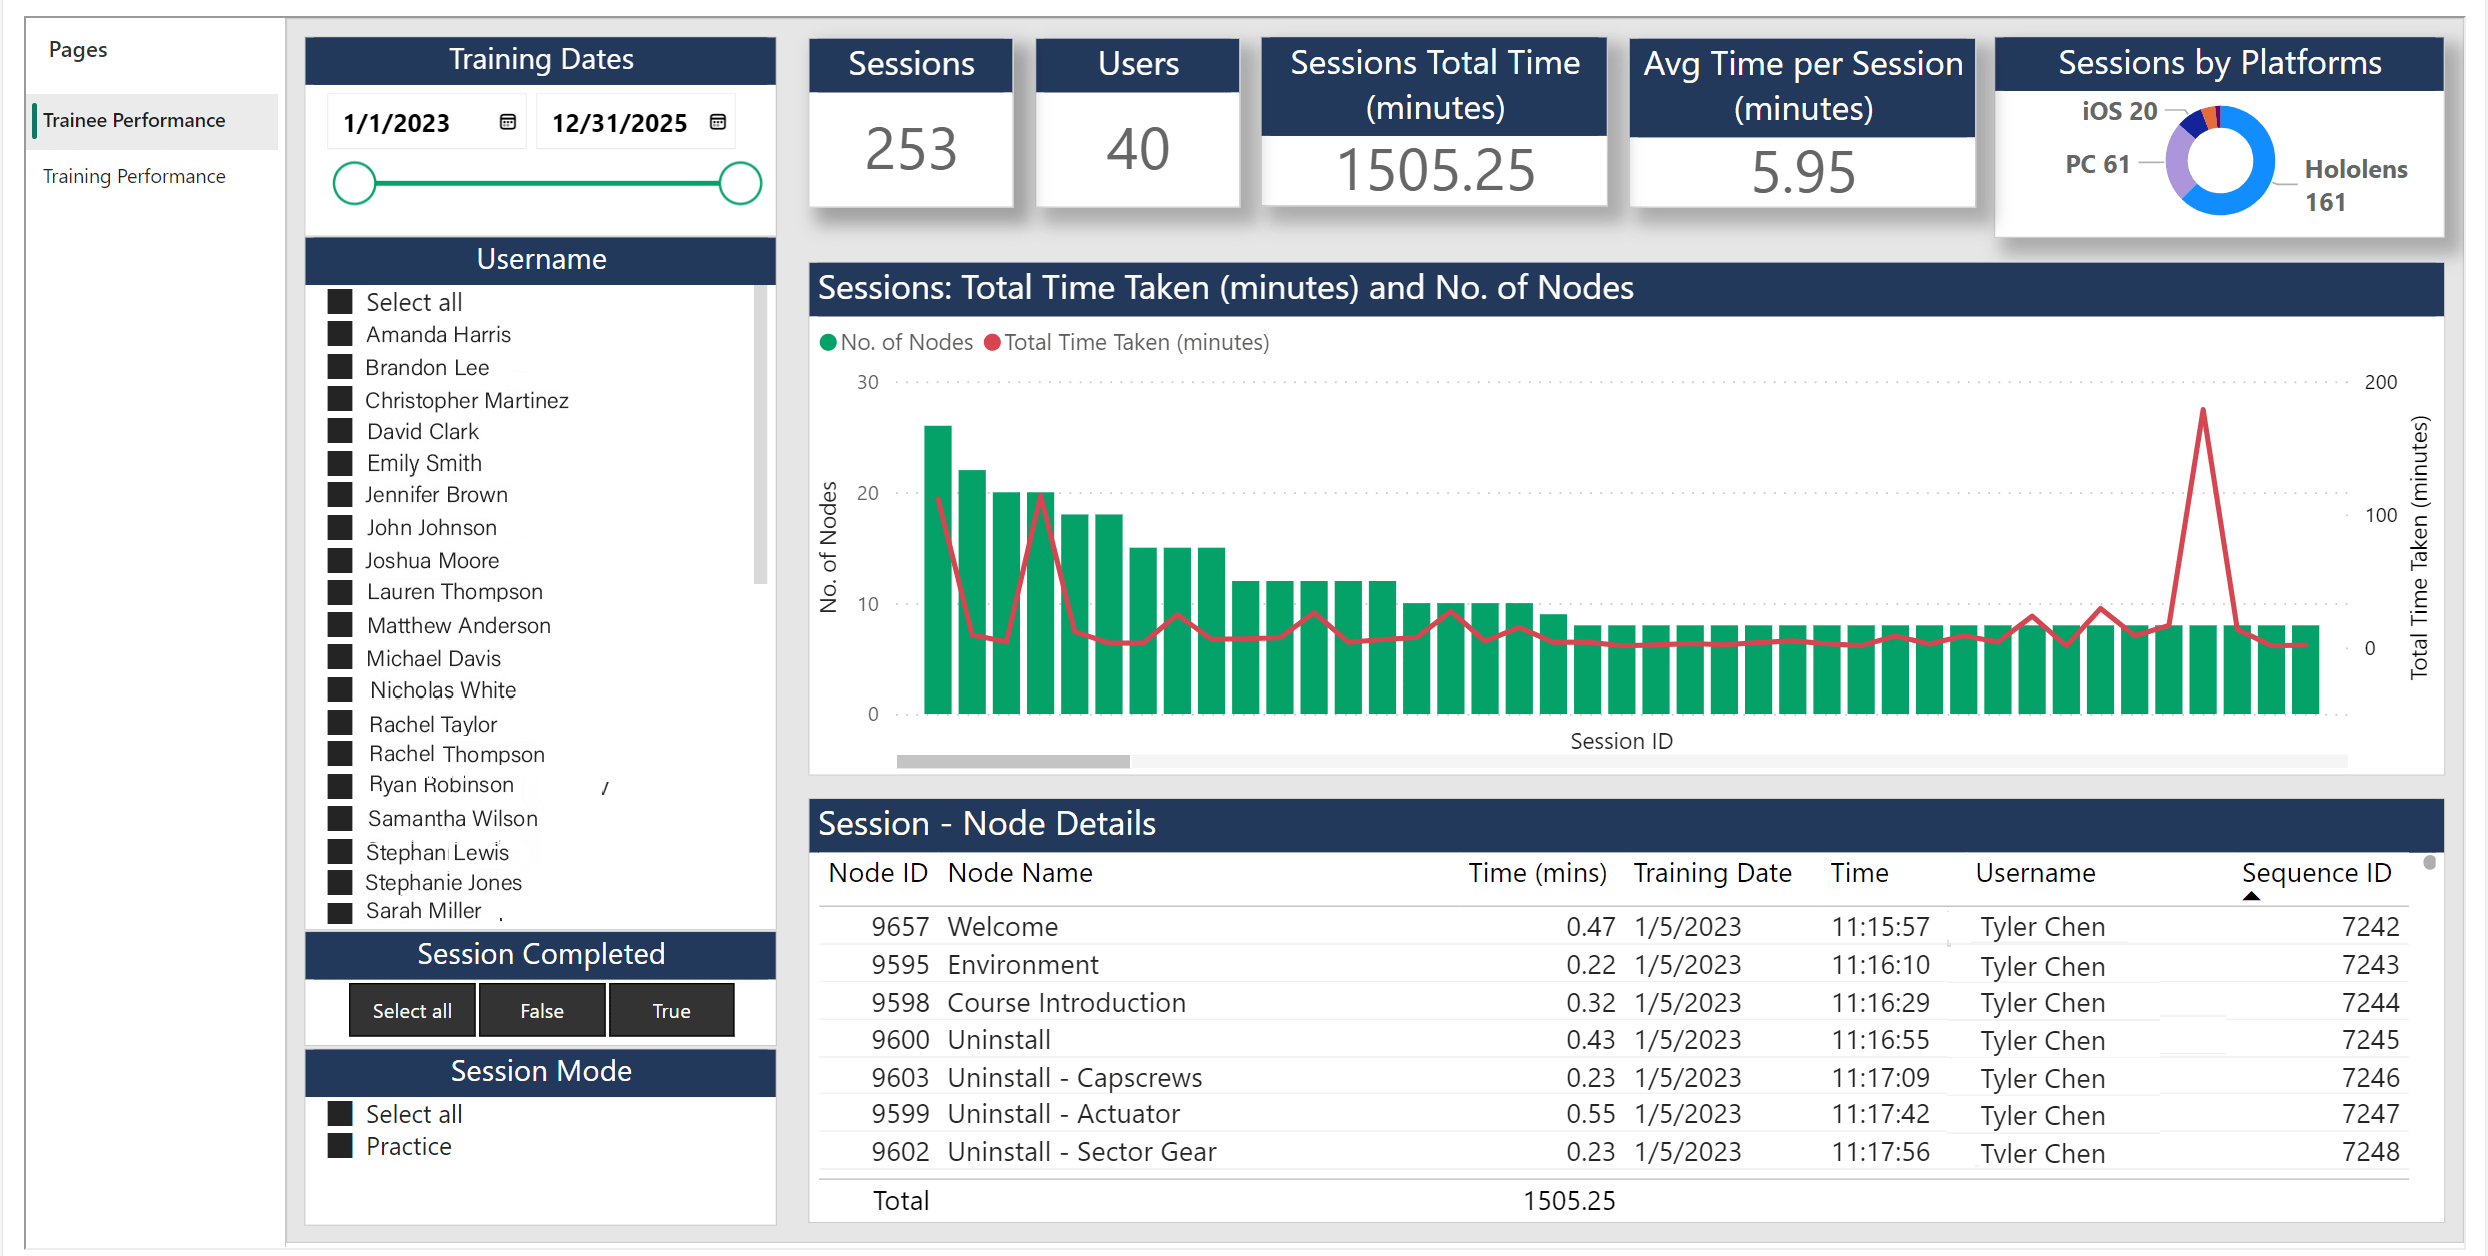
Data Pane

The Data Pane is divided into three interconnected panels. Top Panel The top panel consists of cards that display summary information: a. Sessions - This card in the report displays the total number of sessions that were run for the selected filters in the left pane. b. Users – This card displays the number of users(trainees) that were part of the sessions. c. Session total time – This card displays the total time the trainees spent on the training. d. Average time per session – This card displays the average time taken per session.

Notes:

  1. The Session total time can help understand how well the system is being used.
  2. The Average time per session can be used to understand the complexity of the training that was run. Ideally this number should be decided when the training is created and is often a requirement from business groups who are going to be using this training. Training Owners can use this number to understand how well the training aligned with the initial requirement.
Center Panel The Center panel helps visualize each session. Here, the number of nodes that were stepped through during the session and the time taken to the finish the session is displayed. This pane can help understand the time taken by different trainees to “complete” the training. By selecting a session, users can also focus on just that session and understand it in more detail from the data in the bottom panel. The red line that runs across the Sessions denotes the total time taken for each session. Bottom Panel The bottom panel shows trainee performance per node. This panel displays all the nodes that were run as part of the session, the time taken for each node along with the Training Date and the User information. The Sequence ID in this table can be used to sort the nodes in the order that they were executed. When no session is selected, this panel will display data across all users and all sessions. Once the user selects a session, this panel will display data only for the selected session. This panel could be used to better understand why some users took longer to complete the training than others, by identifying the nodes they took more time on.

Summary

This section allows the user to see overall information across all sessions, compare individual sessions within a cohort and then if needed do a deep dive into one session. Users can further filter and see only trainings within a certain date range or only for certain users by using the filters in the left pane. This visualization provides various insights, including the following: • Session Total Time metric helps understand how long the system has been utilized. • Average Time per Session metric in this visualization helps understand the complexity of the training. Ideally this number should be established when the training is created and is often a requirement from business groups who are going to be using this training. Training Owners can use this number to understand how well the training aligned with the initial requirement. It can also be utilized to understand if the training was too complex and make necessary adjustments to their training programs to ensure that they meet the needs of their learners and their business requirements. • The center panel of the visualization allows for easy comparison of performance across users, making it possible to identify which users have already mastered the procedure being taught and which users may require additional training. • The Node Session details in the bottom panel will help identify the nodes the trainees were struggling with.